
Infographics for SEO are like cherry on top of the cake – they make something good even better! Whenever we search for a topic, we look for something which can quickly and concisely explain what we need to know. And that is also why we need to create infographics that provides a lot of information concisely and in a way that is easy to understand.
Infographics means Information + Graphic that is presenting various information in a graphic format. Yes, just like the ones your math teacher asked you to make after giving you a bunch of text. There are information which cannot be presented easily especially the one with a lot of data, infographics helps to break down those information and present in a way that is not only easy to understand but also visually appealing.
Infographics can be used to display timelines, steps, procedures, varieties and what not. They are also an essential for your content marketing as images are easier to remember than text. And this brings us to our next topic, how can you use Infographics for SEO?
Table of Contents
How Infographics boost SEO
Did you know, the State of searchers behaviour reveals that about 30% of the search results on Google are image-based not text based? Which means when you search for something on Google, a significant portion of result are images, videos or infographics. This highlights the importance of visual content for SEO like Infographics. That’s not all, let’s check out a few more advantages of Infographics for SEO:
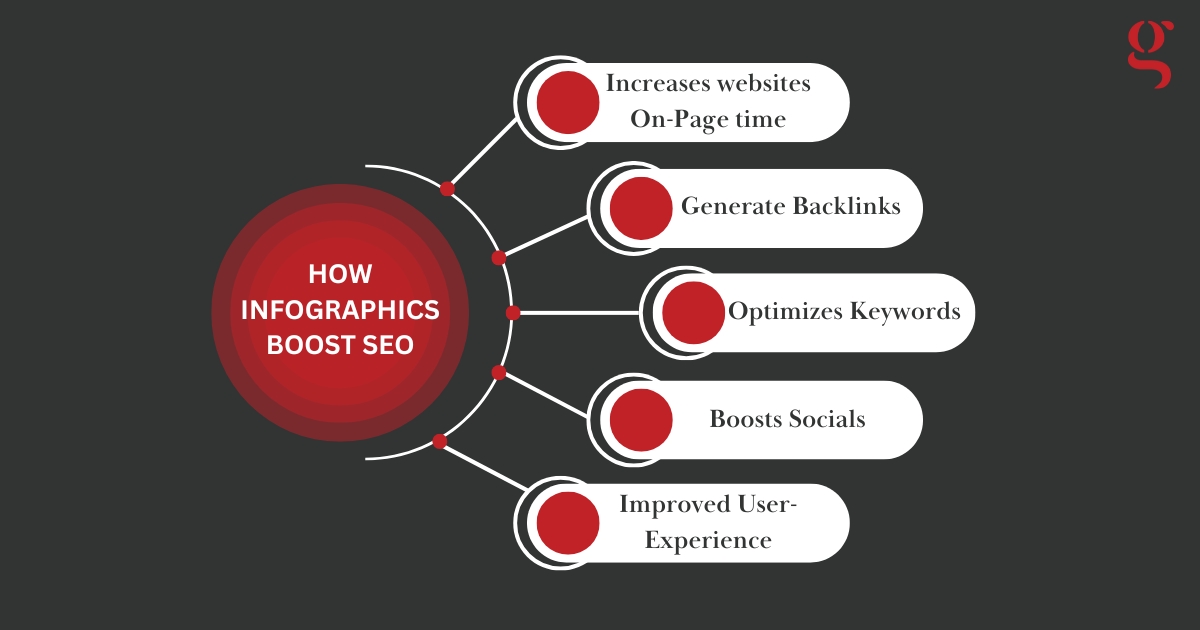
Increases websites On-Page time
What do you check while buying vegetables? How long will they stay fresh? Google does the same thing. It determines how relevant your content is by checking your on-page time which reflects how long a user stays on your site.
Infographics grab users’ attention and keep them engaged longer, signalling to search engines that your content is valuable. Which means better chances to rank higher.
Generate Backlinks
One of the best ways to boost your Website’s SEO is through backlinks. Backlinks are links from other websites to your content. High-quality infographics works great at generating backlinks because they provide valuable information in short that other sites are likely to refer.
The more informative and visually appealing the infographic, the more likely it is to be shared or linked back to by authoritative sites. Creating compelling, shareable infographics not only increases your site’s credibility but also enhances its authority, leading to better rankings and higher organic traffic over time.
Optimizes Keywords
Infographics helps in breaking down a dense piece of content into digestible chunks. When optimised with right keywords, they can improve keyword relevance of your web page. By including the right and relevant keyword in the title, description and alt text of your infographic you can improve its SEO performance.
For example, if you create an infographic about “The Best SEO Strategies” including the keyword “SEO strategies” in the title, description and alt text can help you rank higher for that keyword. Using well researched keywords ensures that your content align with what users are searching for. This approach makes it easier for the search engines to index your content.
Boosts socials
Think about how many memes, information or images are being shared on social media platforms like WhatsApp, Instagram, etc. And do you know how you can use that to increase your reach? By adding your watermarks or logo on the infographic. Search Engines considers social shares as a ranking factor. Infographics being highly visual and easily shareable are often shared more widely, helping your content spread across a broader audience and attracting new visitors to your site.
Improved User-experience
Infographics offer an excellent user experience by simplifying complex data. They helps you to convey important information in a concise and visually appealing way. By creating content that is informative and easy to consume, you are more likely to encourage users to stay longer on your platforms. A well-designed infographic can turn difficult-to-understand information into something engaging and memorable. This not only enhances the user experience but also improves metrics like time on page and lower bounce rates, which are both positive signals for search engines to rank your page higher.
Types of infographic templates for SEO
Infographics come in various types, each designed to present different kind of information in an engaging way. Few of which are:
- Statistical Infographics – Displays data and statistics using charts and graphs
- Informational Infographics – Helps in simplifying complex topics into easily understandable visual chart
- Process Infographics – Show step by step procedure of a process
- Comparison Infographics – Used to display information of different items or concepts.
- List Infographics – Helps display information in a list format. Most commonly used for “Top 10” or “Best 5” recommendations.
Statistical and informational Infographics for seo are most commonly used.
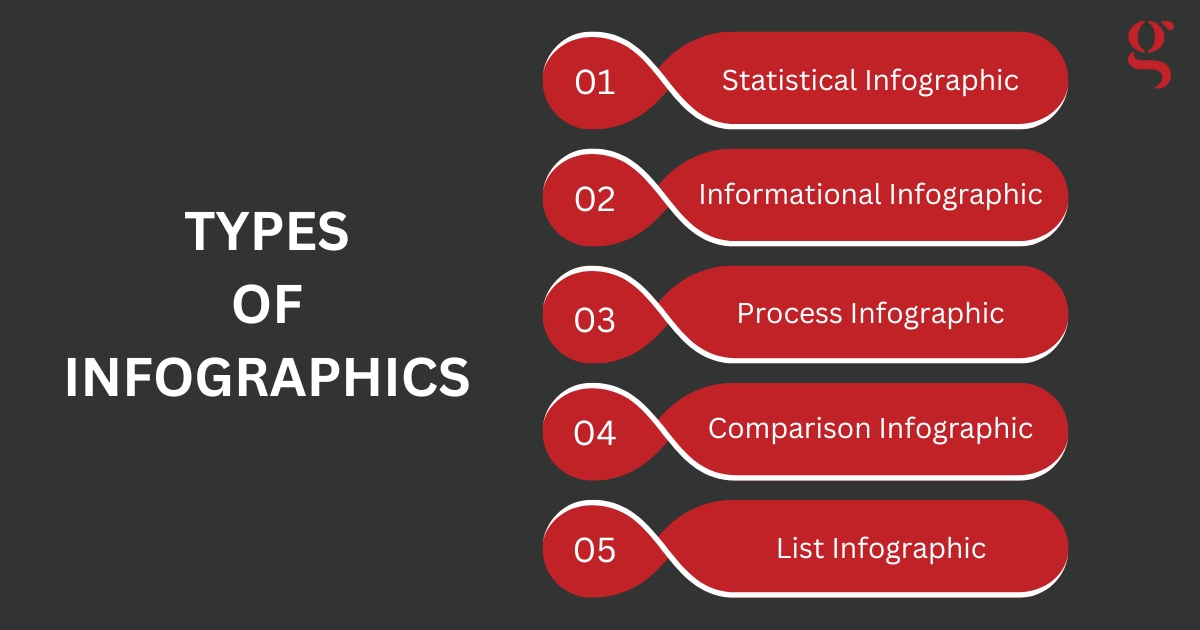
Don’t want to read the above topic about types of infographics? Here’s a visual of a list infographic showing the types of infographics!
Optimise Infographics for better SEO
Apart from being extremely useful and visually appealing, infographics also help in improving your website’s rankings on Search Engines. Here’s how you can optimise your infographics for SEO:
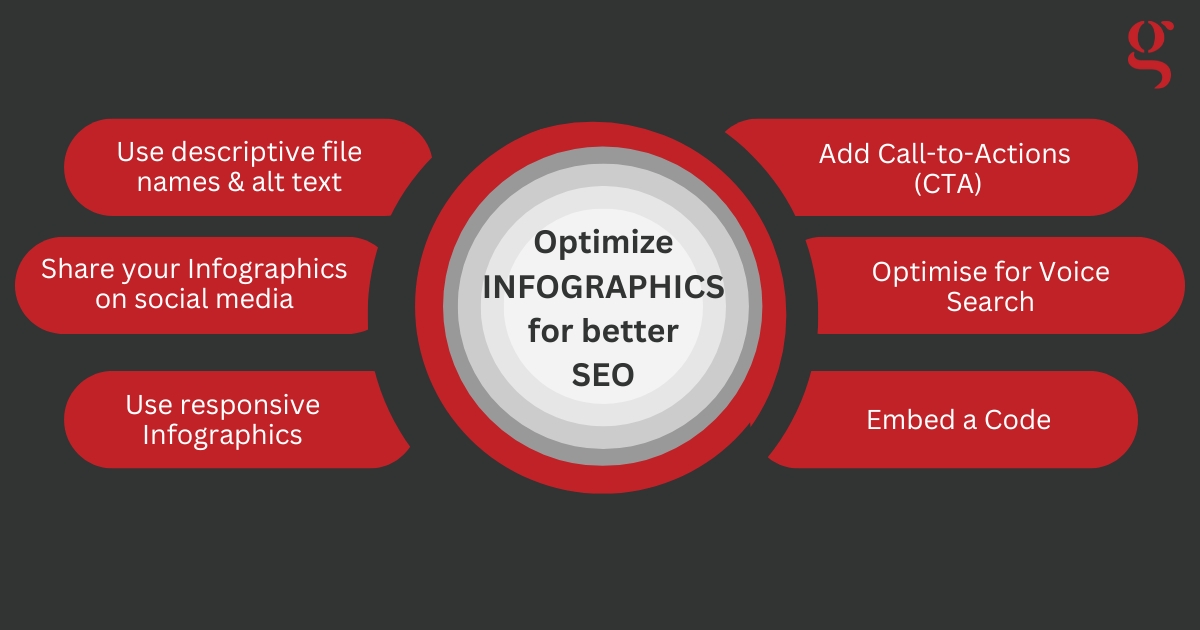
- Use descriptive file names and alt text- Name your infographic files with relevant keyword and use alt text to help search engines understand the content and recognise it. For example, instead of naming your file as “infographics for seo1.jpg” name it “seo-strategy-infographic.jpg”.
- Share your infographics on social media platforms to increase visibility and attract backlinks to improve and enhance SEO.
- Make your infographic responsive for mobile devices and optimize its file size to reduce their size without losing quality this ensures fast load speeds, improving user experience and SEO rankings.
- Add a Call-To-Action (CTA) to your infographic encouraging users to take the next step like downloading a resource, subscribing to your newsletter or exploring other content on your website.
- With the rise of voice-activated searches, it’s important to optimize your infographic for voice search queries. Use natural language and long keywords in your infographic’s title, description and alt text.
- Lastly, embed a code on your infographic. It helps in tracking your reach and engagement. A code immediately links to where the image came from. You can use tools like Venngage, Piktochart or even Canva to generate embed codes for your infographics.
Conclusion
If you haven’t started using infographics for SEO then this is your sign. Infographics are a powerful tool for boosting your websites’ SEO. They break down complex information into engaging and visually appealing graphics. They help you improve user experience and also generate backlinks increasing your on-page time. When used strategically, infographics for SEO can be game changing.
Remember to optimize your infographics for SEO by using descriptive file names, relevant keywords and sharing them across various social media platforms. With the right approach, infographics can make your content not only more accessible and enjoyable to consume but also more likely to rank higher on search engine results pages.
Use tools like Google Analytics to track how your infographics are performing. Check insights such as how many backlinks your infographics are generating. This will help you refine your strategy and enhance your content further.